unit 1.6 - graphing relations
what we need to know
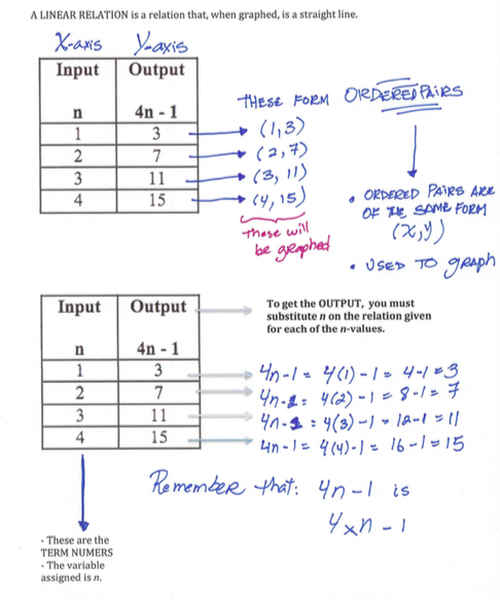
- Input/output tables
- Input = term numbers = X-axis. It always is the first column on the table
- Output = terms = Y-axis. It always is the second column on the table
- Difference between expressions and equations
- Ordered pairs (X,Y)
- X-axis is the horizontal axis
- Y-axis is the vertical axis
- A pattern: it repeats constantly
class notes
|
| ||||
more information
what are linear relations?
LINEAR RELATIONS are relations (algebraic expressions) that, when graphed, result in a straight line (on whatever direction). Take a look at the following graphs:
|
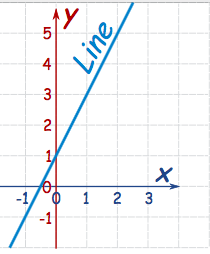
|
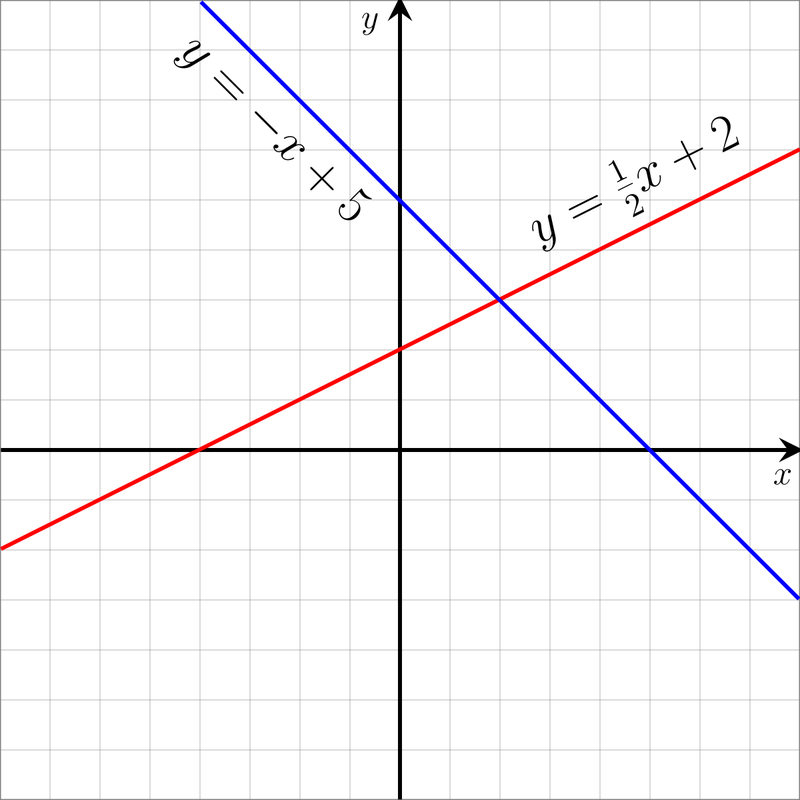
|
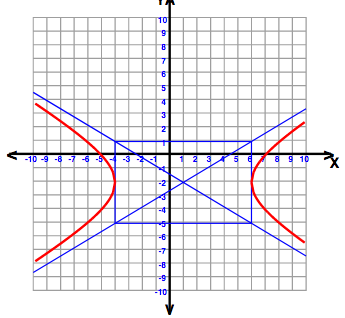
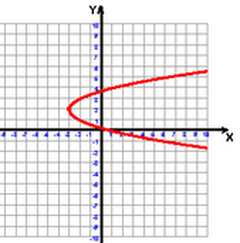
Al graphs above are straight lines, and therefore are linear. Let's take a look at some non-linear graphs:
|
|
|
As you can see, these graphs are mot straight lines, and therefore are considered non-linear.
but, how can we tell if a graph will be linear from a table?
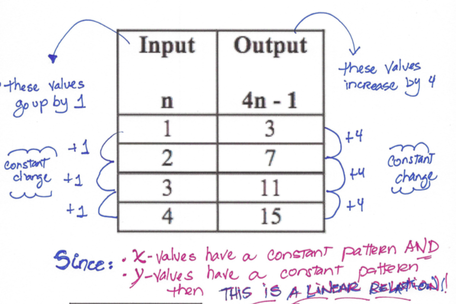
Linear relations, as I mentioned, result in straight lines when plotted. What this means is that for every constant change on the x-axis, there is a constant change on the y-axis. In other words:
You can tell if a table is linear by looking at how X and Y change. If, as X increases by 1 (or a constant pattern),Y increases by a constant rate (even if the pattern is different from the one on the x-axis), then a table is linear. This means, of course, that the relation is linear, and when plotted, you'll get a straight line. Let's look at the following tables:
You can tell if a table is linear by looking at how X and Y change. If, as X increases by 1 (or a constant pattern),Y increases by a constant rate (even if the pattern is different from the one on the x-axis), then a table is linear. This means, of course, that the relation is linear, and when plotted, you'll get a straight line. Let's look at the following tables:
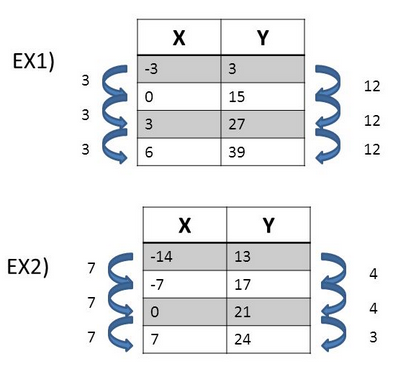
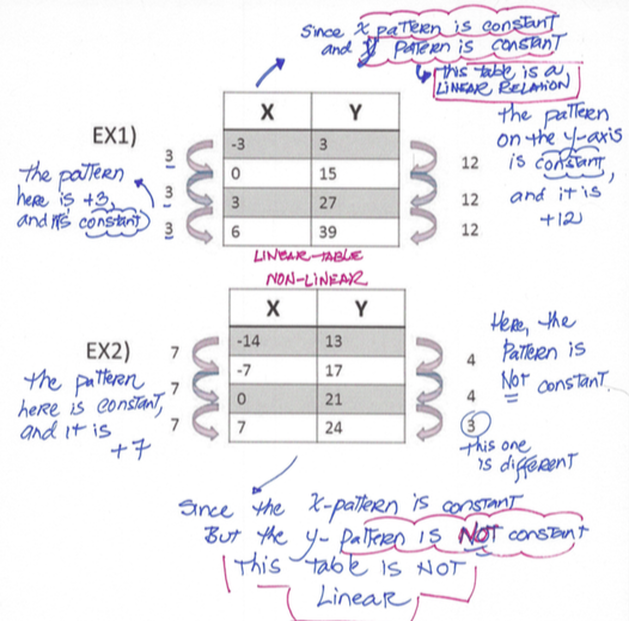
Let's look at the patterns on the tables above:
steps to graph a linear table
- Complete the table of Input/Output table.
- Look at the first column,, the X-axis. Determine whether the change from one number to the next is the same all the way through. That is, whether the pattern is constant.
- Do the same thing with the values of the OUTPUT column, which are the y-axis value.
- If, and only if, both the INPUT and the OUTPUT have patterns that are constant, then the RELATION IS A LINEAR RELATION. Again, the both have to have constant patterns.
- Once you determine that the table and the relation is a linear relation, it may help to make a column with the ordered pairs that you are going to use to graph.
Look at the following:
And so:
To graph:
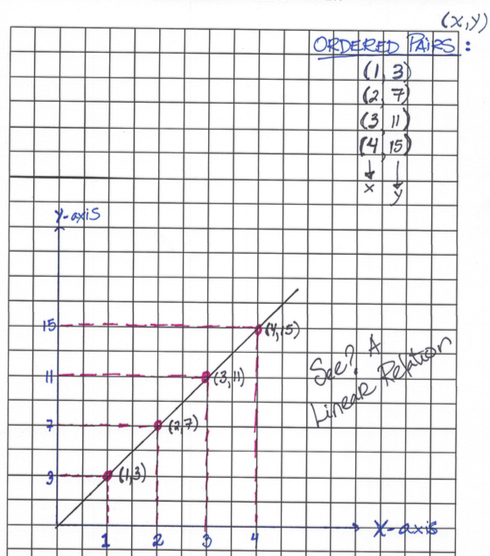
- Get all ordered pairs.
- Plot the ordered pairs.
Here is what the graph for the table above looks like:
- Get all ordered pairs.
- Plot the ordered pairs.
Here is what the graph for the table above looks like:
videos that may help
online interactive activities
worksheets
|
|
| ||||||||||
|
|
|
REVIEW - workbook
| math_7_-_workbook_-_unit_1.6.pdf |
